Your Center Isn't Performing. Supply Is.
Retail real estate is having a victory lap. Vacancy near historic lows. Rents up. J.P. Morgan talking about the strongest shopping center valuations in a decade. Landlords are taking bows.
Here's my problem with the celebration: a lot of it isn't earned.
Yes. This is a generic statement and there are plenty of exceptions. Plenty. And this article may be a little controversial (me controversial? Never 😜)...but hear me out
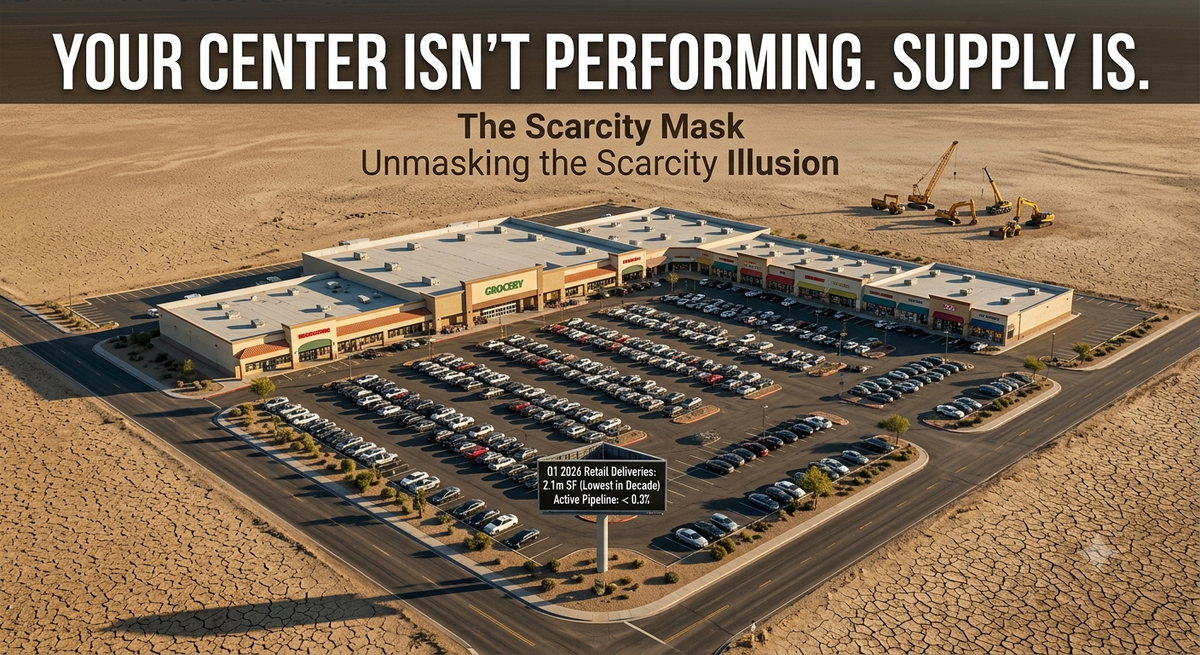
The U.S. retail construction pipeline has collapsed. Only 2.1 million square feet delivered in the first quarter of 2026. The active pipeline now represents less than 0.3% of existing inventory. Colliers expects new retail construction to fall another 37% this year. When nothing new gets built for half a decade, every existing center looks like a winner. Full parking lots and rising rents stop being evidence of asset quality. They become evidence of no alternatives.
I call this the scarcity mask. And a lot of mediocre real estate is wearing one right now.
The numbers underneath the numbers
Look closer at Q1 and the mask starts to slip. Retail absorption opened 2026 negative for the third consecutive year: the market gave back 4.6 million square feet across all shopping centers. Vacancy ticked up. And yet asking rents still grew 2.3% year over year to $25.48 per square foot.
Sit with that combination for a second. Demand is softening. Rents are rising anyway. There is exactly one force that produces both at the same time: supply constraint. Not merchandising skill. Not tenant curation. Not placemaking. Scarcity.
Store closures outpaced openings by nearly 6,000 locations across 2024 and 2025, and vacancy barely moved. That is not resilience. That is a market where the denominator stopped growing.
Meanwhile, June CMBS data showed retail delinquencies climbing even as the overall delinquency rate improved. The debt markets are telling us something the leasing stats are hiding: underneath the aggregate strength, specific assets are struggling to cover.
What a masked asset looks like
I keep seeing a version of the same center. Grocery-anchored. Fully or nearly fully leased. Rents at or above market. On paper, a core asset.
Walk it on a Tuesday. The grocery anchor is a weak operator: thin produce, understaffed, the kind of store people settle for rather than choose. The restaurant spaces are struggling or quietly transitioning, one concept swapping for another every 18 months. The center is not busy. It is occupied. Those are different things.
That asset is collecting scarcity rents. The tenants are there because there is nowhere else to go, not because the center earns their sales. The recent visitation data backs the pattern: shoppers spent May flocking to entertainment venues and discount formats while pulling back on restaurants and grocery trips. The exact tenant categories propping up these centers are the ones losing visit share.
The two signals that don't lie
So how do you tell a genuinely strong asset from one riding the drought? The metric everyone wants is tenant sales productivity: sales per square foot against occupancy cost. It is also the metric you mostly can't get. It's retailer internal, unevenly reported, and nearly impossible to validate from the outside. Underwrite on it and you're underwriting on trust.
Two behavioral signals are observable, and they do the job:
Repeat visit rate. Scarcity fills a center once. It does not bring anyone back. A center whose visitors return weekly has earned a habit. A center with high one-and-done share has earned a lease signature and nothing else. When supply returns, habits stay. Signatures move.
Cross-shopping share. What percentage of visits touch more than one tenant? A real center is an ecosystem: the grocery trip feeds the coffee stop feeds the quick lunch. A masked center is a collection of unrelated errands sharing a parking lot. The first is defensible. The second is a rent roll waiting to be poached.
Neither signal requires the retailer's cooperation. Both are visible in visitation data if you ask the question. Which, per usual, is the actual gap: not the data, the question.
"But the drought will last"
I side with Colliers here. I don't buy the near-term supply recovery. Construction costs, labor, and capital discipline all point to the drought deepening before it breaks, and when building resumes it will be redevelopment-led and gradual, not a wave. It takes too long to construct and fill to be quick.
If anything, that makes the audit more urgent, not less. A short drought exposes weak assets quickly and painfully. A long drought does something worse: it compounds complacency. Five more years of scarcity rents means five more years of refinancings, valuations, and hold decisions built on performance the asset never generated. The longer the mask stays on, the bigger the write-down when it comes off. Two of the market's smartest research shops can't even agree on the direction of supply this year (Newmark is publishing that redevelopment-led starts recover now) which tells you how little conviction underlies the consensus.
The Monday morning version
If you own or underwrite retail, run the honest audit now, while the market is still grading on a curve:
Separate every asset's performance into what the asset earns and what scarcity provides. Pull repeat visit rate and cross-shopping share for the portfolio (as well as any other data points that answer the asked question(s)). Rank centers by behavioral strength, not occupancy. Then ask the uncomfortable question about each one: if a competing center delivered two miles away in 2029, which tenants would leave?
If the answer is most of them, the rent roll is not an asset. It's a countdown.
Scarcity is doing the industry's thinking for it right now. The owners who let it will discover, at the worst possible moment, the difference between a center people choose and a center people are stuck with.
IN THE NEWS
Coresight: retail sales peak at midyear, and temporary supports are masking underlying weakness. Coresight's June outlook projects U.S. retail sales momentum softening after a June peak, with tax refunds propping up demand while savings decline and real incomes weaken. Their word choice is instructive: headline strength "masking" deteriorating fundamentals. Sound familiar?
Retail delinquencies climb even as headline CMBS improves. June's CMBS delinquency rate fell to 7.35%, but retail delinquencies moved the other direction. The aggregate looks healthy; the asset-level story underneath is diverging. Debt markets grade individual assets. Leasing stats grade the average.
Visit patterns keep bifurcating. May visitation data showed shoppers flocking to entertainment venues, discount stores and department stores while limiting trips to restaurants, grocery stores and home-related retailers.
Saks Reemerges From Chapter 11 Seeking Growth In A Slimmer High-End Retail Portfolio. "Exemplar Luxury Group, the newly renamed parent of Saks Fifth Avenue, is stepping out of Chapter 11 with less debt, fewer stores and a clear signal to landlords and vendors that it wants to compete as a focused, full‑price luxury platform rather than a sprawling off‑price chain."
First Walmart, Now Sephora: The Major Retail Shift Changing the In-Store Experience. "Following a successful 32-store pilot, the beauty retailer will institute “quiet hours” at its locations. Here’s why."
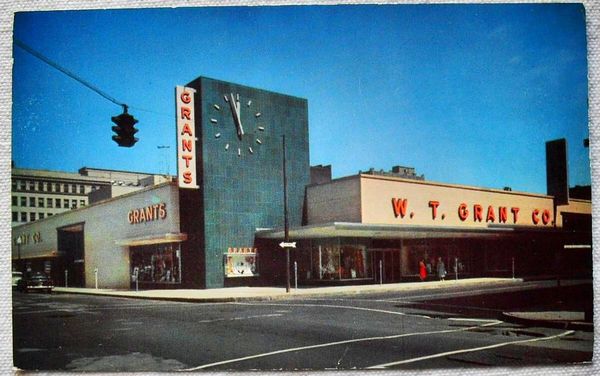
Nostalgic Retail Spotlight: CALDOR
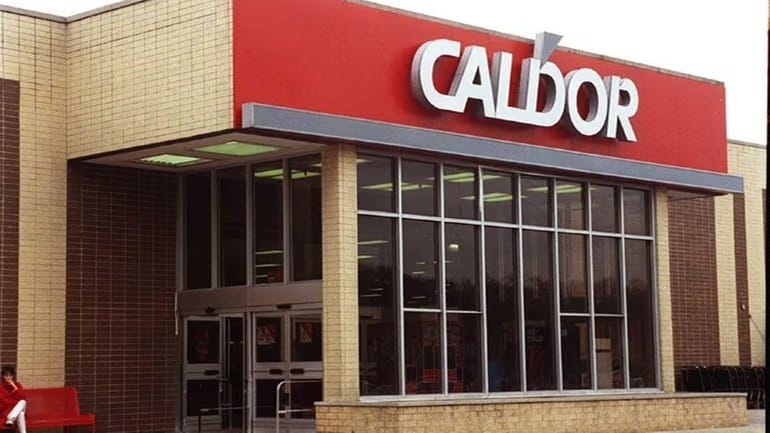
The Bloomingdale's of discounting. And the cleanest supply lesson in the retail graveyard.
Founded in 1951 by Carl and Dorothy Bennett, who pooled $8,000 in savings and combined their first names to create the brand. Caldor sold quality national brands at discount prices, never closeouts or irregulars, in stores with wide aisles, bright lighting and informed staff. Design borrowed from upscale retail, prices borrowed from the discounters.
The timeline:
- 1951: Second-story "Walk-Up-&-Save" opens in Port Chester, New York.
- 1961: Goes public.
- 1981: 63 stores, nearly $700 million in revenue. Associated Dry Goods (owner of Lord & Taylor) acquires the chain and opens 20+ stores a year.
- 1984: Carl Bennett retires with 100 stores and over $1 billion in sales.
- 1986: May Department Stores buys ADG in the era's most expensive retail merger ($2.2 billion). Cost-cutting strains operations.
- Mid-1990s: Fourth-largest discount department store chain in the country.
- September 1995: Chapter 11.
- May 1999: All 145 stores closed.
What built it: disciplined geography. Stores stayed within a day's travel of headquarters and distribution. For four decades, Caldor was the best option in the Northeast that national discounters hadn't reached.
What killed it: the supply arrived. Walmart and Kmart pushed aggressively into the Northeast in the early 1990s, and Target followed. Caldor's performance had always been part operational excellence, part regional scarcity. When real competition finally delivered into its trade areas, the scarcity portion of its results evaporated, and the operating model underneath couldn't carry the difference.
Caldor didn't get worse in 1995. Its market got more supply. The rainbow-striped storefronts were replaced by Target, Walmart and Kohl's. Forty years of looking strong. Four years from first real competition to liquidation.