The Household Has a Rent Roll Too
In 2024 the average American household spent $1,993 on vehicle insurance and $1,985 on all apparel and services combined. Shoes, coats, work clothes, school clothes, alterations, dry cleaning, the whole category. Car insurance edged it out by eight dollars.
That number comes from the BLS Consumer Expenditure Survey, and it is the cleanest single picture I have seen of what happened to the American wallet while our industry was busy congratulating itself on occupancy.
Nobody cancels their car insurance.
What the Survey Actually Says
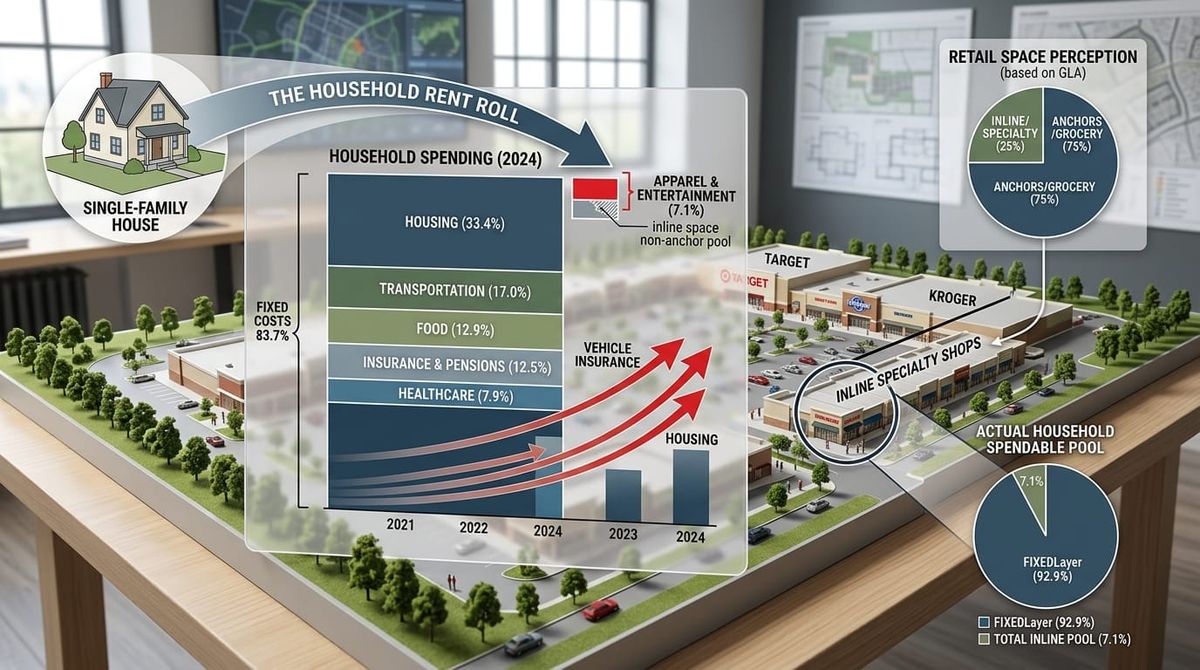
The average household spent $78,535 in 2024. Housing took 33.4% of it. Transportation 17.0%. Food 12.9%. Personal insurance and pensions 12.5%. Healthcare 7.9%. Those five components account for 83.7% of everything an American household spends.
Entertainment is 4.6%. Apparel and services is 2.5%.
Sit with that pair for a second, because roughly seven cents on the household dollar is the entire pool that most of a shopping center's non-anchor GLA is leased against. Not the anchor. Not the grocer. The inline space. The soft goods, the specialty, the stuff a leasing plan calls merchandising.
The direction is worse than the level. Of fourteen major expenditure components, only four declined in 2024. Two of the four were entertainment and apparel, and entertainment was the only major category to shrink outright. Vehicle insurance ran the other way: $1,592 in 2022, $1,775 in 2023, $1,993 in 2024. Housing rose 3.3% in 2024 after rising 4.7% the year before, with owned dwellings up 7.0%.
Deloitte's Digital Media Trends survey, fielded with 3,575 consumers in late 2025, found the average subscribing household carrying four streaming services at $69 a month, up 13% in a year. That is a small line next to housing and insurance. It also arrives the same way they do, which is automatically, before anyone decides anything.
Everything That Clears First
Think about how a household actually spends now. Housing clears. Insurance clears. The phone bill, the utilities, the car payment, the pharmacy, the four streaming services. All of it leaves the account on a schedule, most of it without a decision attached, and most of it repriced upward every renewal.
Whatever survives that sequence is what walks into your center.
Retail is a residual claimant on the household P&L. It was always somewhat true. What changed is the size of the first claim and the speed at which it grew, and the fact that the categories doing the growing are the ones nobody can decline.
McKinsey's ConsumerWise research, fielded in early May of this year, shows spending intent falling across most discretionary categories, sharpest among low-income households but present at the top of the income distribution too. Corbin Advisors, reading Q2 2026 earnings calls, found essentials holding while discretionary slowed, with trade-down and consumer financing doing the work of keeping baskets intact. How people are paying has become as telling as what they are buying.
Why This Breaks Underwriting and Not Just Merchandising
Here is the part that should bother anyone who signs leases.
A sales per square foot assumption is a claim about share of wallet. So is a percentage rent breakpoint. The natural breakpoint is base rent divided by the percentage rate, which means it moves with rent and has no relationship whatsoever to what the household in that trade area can still afford to spend. Rent goes up, the breakpoint goes up, and the pool the tenant is reaching into gets thinner at the same time. The percentage rent clause is still in the lease. In a lot of centers it has quietly become decoration.
This also produces a specific failure that gets misdiagnosed constantly. Traffic holds flat. Sales soften. The landlord decides the tenant has a merchandising problem. The tenant decides the center has a co-tenancy problem. Both are looking at the wrong variable, because the customer did come, got counted, and simply had less to spend when she got there.
Foot traffic data is honest about visits. It has nothing to say about what was in the wallet.
The Variable Nobody Maps
Median household income is the demographic everyone pulls first. It is also close to useless on its own for this question.
Two trade areas can report the same median income and have completely different discretionary capacity, because housing cost burden, auto insurance rates, property tax, commute distance and healthcare cost vary enormously across short distances. A household at $95,000 in a market where housing eats 40% of spending and insurance runs $2,600 is a materially different customer than a household at $95,000 where housing takes 26% and insurance runs $1,300. Same dot on the income map. Different shopper entirely.
Now take the harder case. Give those two households identical capacity, the same eleven hundred dollars a month surviving the fixed layer, and they will still spend it in completely different places. One puts it into the kids and the house. One puts it into dining and travel and buys clothes twice a year at full price. One will not spend it at all, because the behavior that produced the surplus is the same behavior that protects it.
That second question is the one persona and psychographic data was built to answer, and it answers it well. Segmentation of that kind is a real improvement over drawing a ring and reading census tables, and the good implementations tell you things about local behavior that no income figure ever will.
The trouble starts when it gets used to answer both questions at once. A persona read tells you what a household would spend money on. It has no opinion about whether the money is there. Run a segmentation across a market where housing burden jumped eleven points in four years and you can get a beautifully accurate portrait of a shopper who cannot currently afford to be that person.
Capacity comes first. Propensity allocates what capacity leaves behind. Most site work skips straight to the second one because that is the layer the industry has spent a decade getting good at.
All of those inputs are geographic. All of them are available. Almost nobody builds them into a site model, because the model was designed to answer how many people and how much they earn, and the question that matters now is how much is left.
I have read a lot of pro formas over the years. I cannot remember one with a line for the household's fixed-cost burden, and I have never been asked for one.
That is a gap worth closing before the next round of renewals, not after.
So try this on a center you know well. Pull the trade area's median income, then pull housing cost burden and average insurance cost alongside it. Subtract. Whatever persona work you already have, lay it over that remainder rather than over the income. Then go look at your inline rents and your breakpoints and ask whether they were set against the first number or the third one.
Which of your centers is underwritten against household income that the household never actually gets to spend?