The New Trade Area has an Old Problem
In May I moderated a session at ICSC Las Vegas called "The End of the Trade Area" with Meghann Martindale of Avison Young, Ethan Chernovsky of Placer.ai, and Sam Hall of Growth Factor. The premise was blunt: the radius-based trade area is a 60-year-old concept, and real consumer behavior stopped respecting the ring a long time ago. Loyalty, lifestyle, digital, mobility. None of it draws a circle.
Two months is enough distance to write a retrospective, so I sat down to figure out what I got wrong or the panel missed. I couldn't find it. What I found instead was a sharper version of the problem, and it came from the panel itself.
The Point That Stuck
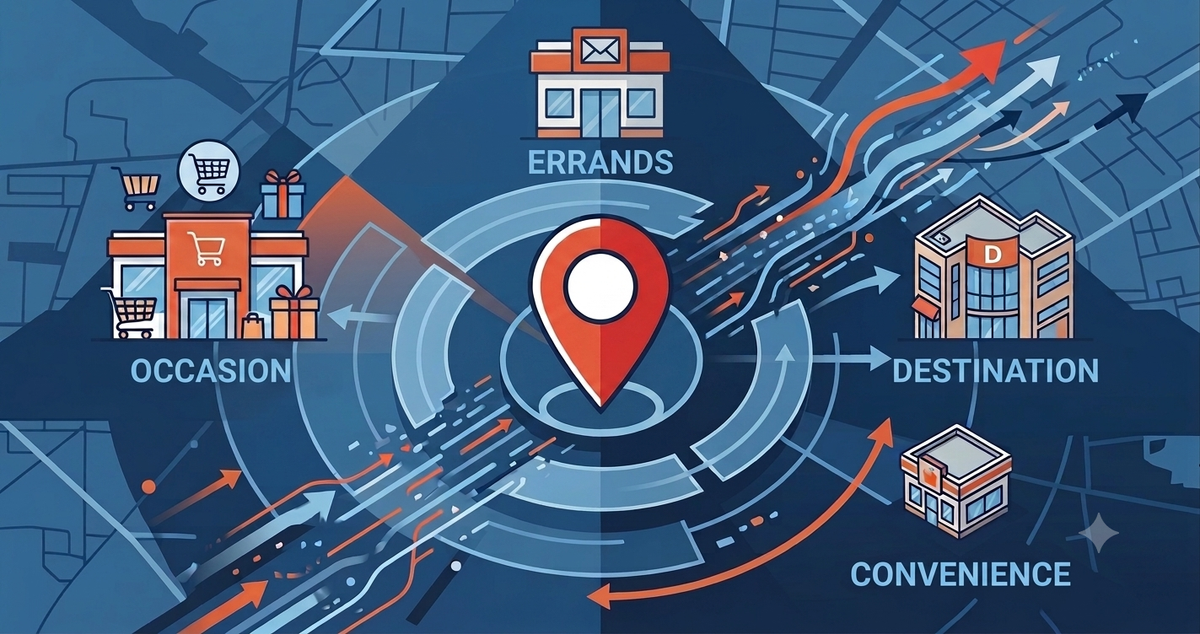
The moment I keep returning to started with Meghann: trade area calculation has to change with the purpose of the property. A quick-service pad site and a destination entertainment center require different math. Different inputs. Different questions. Different definitions of who even counts as a customer.
That sounds obvious written down. Almost nobody operates that way.
Here is a concrete version. Mobile location data performs poorly on fast food and quick in-and-out convenience visits. The dwell times are too short for reliable capture, so the visit gets missed or misattributed. If your trade area methodology for every property is "pull the mobile data," you have built a model that systematically undercounts the exact behavior a QSR or convenience concept lives on. The dataset that revolutionized destination retail analysis is structurally blind to the convenience trip.
We Replaced the Ring With a New Ring
This is the part I would argue harder now than I did on stage in May.
For 60 years the industry ran one standard: rings and drive times for everything. Then the correction arrived, and the industry did what industries do. It installed a new standard: mobile location data and behavioral overlays for everything.
The circle was a symptom. The underlying error was the assumption that one method fits every property. That assumption survived the funeral. We upgraded the inputs and kept the laziness.
The sequence has to run the other way. Purpose first. What is this location for? Convenience, destination, errand, occasion. Purpose determines the questions worth asking. The questions determine which data can answer them. Any process that starts with the dataset has already skipped the step that matters.
Then AI Made it Worse
Retrospectives are supposed to include a confession, and mine is that the two months since Vegas made the old model look worse, courtesy of AI.
Since May, the pattern I keep running into is people asking AI for trade area answers on the assumption that trade area analysis is one uniform exercise, so a machine can simply do it faster. AI is happy to oblige. It doesn't ask what the property is for. It answers the question you gave it, using whatever standard method the prompt implies.
I wrote in March that the real gap in this industry is knowing what to ask, and AI has stretched that gap wider. AI industrializes the default. It makes the standard method faster, cheaper, and more confident. When the standard method is wrong for the property type, you get the wrong answer at scale, delivered quickly, wrapped in a clean interface. Speed does not fix a methodology problem. Speed compounds it.
The trade area is not one thing. It never was. The radius pretended otherwise for 60 years, and the new toolkit is one bad habit away from pretending the same thing with better data.
Before your next site package, answer one question first: what is this location for? If the answer is convenience, half the standard playbook does not apply to you. If you cannot answer at all, no dataset will draw the trade area for you.
IN THE NEWS
Spending won't crack, despite dreadful consumer sentiment (Census Bureau via Axios, AP).
June retail sales rose 0.2%, the fifth straight monthly gain, and the headline understates it: excluding gas stations, sales climbed 0.7% while falling pump prices dragged gas receipts down 5.3%. Online sales rose 1.9% on the back of Prime Day, autos gained 1.9% on manufacturer incentives, and clothing fell 0.3%. The consumer is still spending. The mix keeps migrating toward promotions, incentives, and value channels, and that migration is the actual story.
Two back-to-school surveys, one consumer (JLL, Deloitte).
JLL's survey of 1,022 parents has per-child budgets up 11.7% to $489, with Walmart the planned destination for 77.3% of shoppers and dollar stores cracking the top 10 for the first time. Deloitte's survey has K-12 spending flat at $30.4 billion, down 6% adjusted for inflation, with 57% of parents expecting the economy to worsen, the survey's highest reading since 2020. Read together: dollars up, units down, and the parents Deloitte calls hyper value-seekers plan to spend 14% more than everyone else. Value-seeking is the methodology now.
Retail Leads July CMBS Maturity Wave as Refinancing Tightens (Trepp via CRE Daily).
July's hard CMBS maturities total $2.54 billion with retail, and regional malls specifically, carrying the largest exposure. Thirty-six percent of 2026 maturities sit at a debt yield of 8% or lower, and special servicing rates are rising. The strongest retail fundamentals in a decade and a debt stack that does not care. While the equity market pays a scarcity premium across the quality spectrum, the refinancing market is quietly doing the asset-level sorting.
Quarterly retail and consumer trends (Deloitte).
Deloitte's latest retail trends research tracks the shift from shoppers manually searching and comparing products to handing those decisions to AI assistants. If the agent makes the pick, brand discovery moves upstream of the store visit and the store's job compresses toward fulfillment and experience. For landlords, the question underneath: what happens to impulse-driven categories when the shopping list is written by a machine?
Latest Spending Data Highlight Affluent Shoppers As The Primary Driver Of Store Performance (GlobeSt).
The U.S. consumer economy is increasingly reliant on a small group of affluent households and that imbalance is becoming a core risk factor for retail and mixed‑use real estate.
Nostalgic Retail Spotlight: HOWARD JOHNSON'S
Check out all 50+ former retailers and restaurants in the Nostalgic Retail Series HERE.
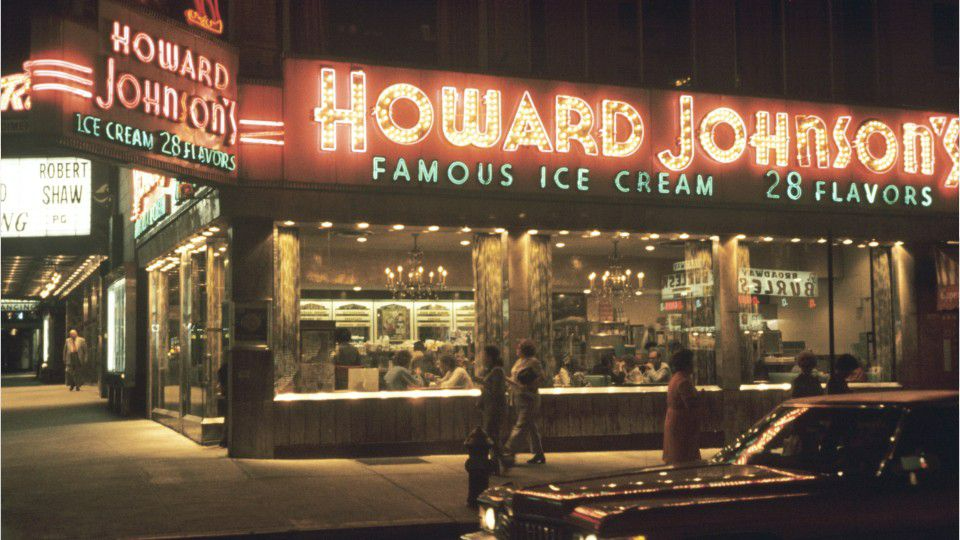
Standardization was the product. Howard Deering Johnson started with a Quincy, Massachusetts soda fountain in 1925, pioneered restaurant franchising in 1935, and built the orange-roofed template that made every location interchangeable: same building, same menu, same 28 flavors, sites picked by the highway. By the mid-1970s it was the largest restaurant chain in America, with more than 1,000 restaurants plus the motor lodges.
The template worked as long as behavior matched it. Then the 1970s oil shocks cut highway travel, fast food outflanked the format on speed and price, and the family sold to Imperial Group in 1979. The chain spent four decades shrinking. The last Howard Johnson's restaurant, in Lake George, New York, closed in 2022.
Every location was identical. That was the point, and then it was the problem. A standardized model cannot see behavior leaving, because it was never looking at behavior in the first place. It was looking at the template.
Sound familiar?